
Five States of a Premium: Watching a Stock's Valuation Story Change Before the Price Does
Diligence analysts usually notice a stretched valuation premium cracking only after the price has already moved, and LacunaIndex's five-state valuation-spread classification is built to flag that shift in peer-relative pricing before it shows up as a headline move.
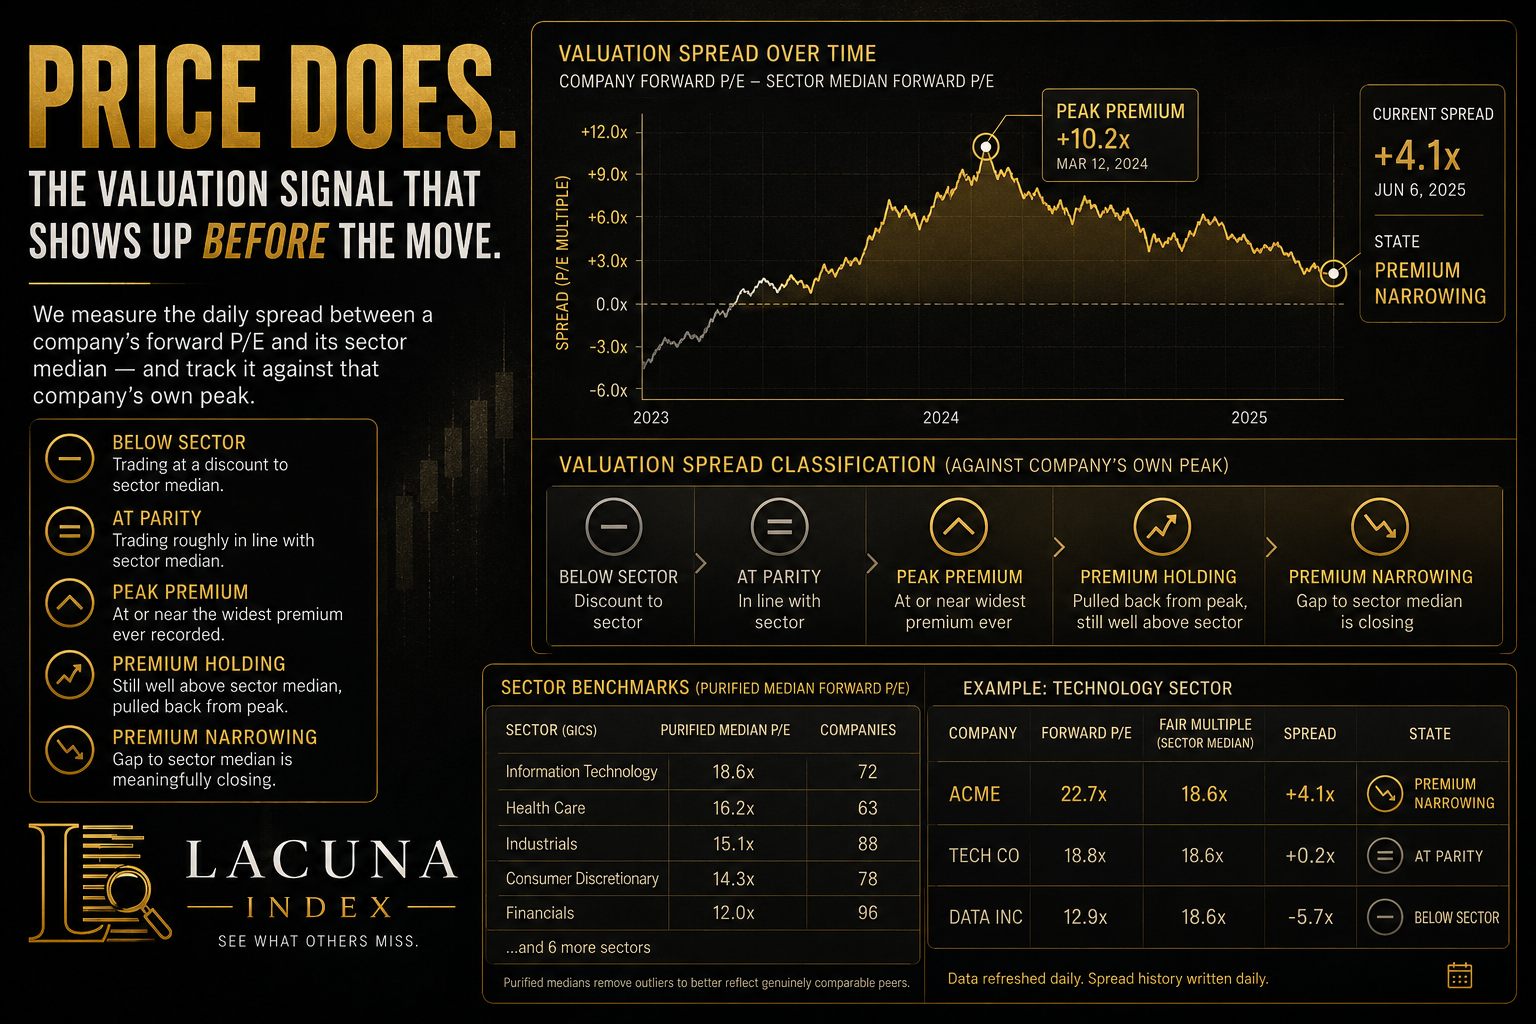
Five States of a Premium: Watching a Stock's Valuation Story Change Before the Price Does
By the time a stretched valuation multiple corrects, the price has usually already moved. Diligence analysts who wait for the multiple itself to crack are, by definition, reading the signal after the market has repriced it. The more useful question is upstream: is this company's premium to its sector still supported by something real, or is it running on a story that has stopped adding evidence?
That is the specific question LacunaIndex's valuation-spread classification is built to answer, and it is worth walking through in plain terms — what it measures, what the five possible states mean, and what changed recently to make the underlying data fresher.
What's actually being measured
For every company LacunaIndex covers, the platform computes a daily "spread" — the gap between that company's forward price-to-earnings ratio (a stock's price divided by its expected future earnings per share, commonly called forward P/E) and the median forward P/E of its sector or curated peer group. That spread is written to a running history table every day, not recomputed from scratch on demand, so there is an actual time series of how a stock's premium (or discount) to its peers has moved — not just a single snapshot.
The company's current spread is then compared against its own peak spread over that history. That comparison — current versus peak, not current versus zero — is what produces one of five states:
- Below sector — the stock trades at a discount to its peer group's median multiple.
- At parity — its multiple sits roughly in line with the sector median.
- Peak premium — the stock is trading at or near the widest premium to its sector it has ever recorded.
- Premium holding — the stock has pulled back slightly from its peak premium but is still trading well above the sector median.
- Premium narrowing — the gap between the stock's multiple and the sector median is meaningfully closing from its own peak.
The useful distinction is between "peak premium" and "premium narrowing." A stock sitting at peak premium isn't necessarily overvalued — plenty of businesses earn a durable premium. But a stock that has moved from peak premium into narrowing, while the underlying narrative (guidance, disclosures, executive commentary) hasn't visibly changed, is exactly the kind of divergence a diligence process should want flagged early rather than discovered in a quarterly screen.
Why this is a diligence signal, not just a chart
This spread classification sits inside a broader public benchmark layer that publishes purified median multiples across 11 sectors (using the Global Industry Classification Standard, or GICS, the standard scheme used to group public companies by industry) and 25 more granular industry groups, alongside each company's raw multiple and its gap to that purified median — what LacunaIndex calls a company's "Fair Multiple." The point of publishing both the raw and the purified benchmark side by side is that a sector median can be distorted by one or two outliers; a purified median strips that out so the comparison is closer to what a genuinely comparable peer set is trading at.
For a diligence workflow, that means the valuation-spread state isn't a standalone stock screener output — it's a benchmark-relative signal that can be cross-checked against a company's peer-group multiples on the same page, and against the deeper forensic report for names where the state itself (say, a fresh move into "premium narrowing") is reason enough to dig further.
What changed recently
This state classification is only as useful as the pricing data underneath it, and that data pipeline was substantially reworked in the last few days. Previously, syncing a peer cohort in the platform refreshed only revenue figures for the tickers in it. As of this week, a cohort sync now also refreshes live pricing data — price, market capitalization, and trailing and forward multiples (P/E, enterprise value to EBITDA — earnings before interest, taxes, depreciation, and amortization — price-to-book, price-to-sales, and dividend yield) — for every ticker in the group, and triggers a fresh valuation-spread snapshot run at the same time. In practical terms: pulling up a cohort and syncing it no longer leaves the valuation map running on stale multiples while only the revenue numbers update underneath it.
A second, smaller change from the same batch of work makes the "recently run" list of issuer reports more honest: when a cohort sync reuses an already-current report instead of regenerating it, the platform now still marks that ticker's timestamp as touched, so it correctly shows up as recently reviewed rather than silently dropping out of the list. Neither change alters the classification logic itself — the five states above are unchanged — but both matter for anyone relying on cohort-level views to reflect current market pricing rather than whatever was last generated.
How to use it without over-reading it
A few honest limits worth stating. The spread classification is a market-multiple comparison — it says nothing on its own about why a premium is widening or narrowing, only that it is. It is not a prediction of where the price goes next, and it should not be treated as one. Where it earns its place in a diligence process is as a triage signal: among a coverage list of fifty or a hundred names, it's a fast way to identify which companies have quietly shifted from "priced at a durable premium" to "premium eroding" — and are therefore worth a closer read of the underlying forensic report, disclosures, and peer benchmarks — before that shift shows up as a headline move in the stock.
LacunaIndex publishes free, citable valuation benchmarks across sectors and curated peer cohorts, built entirely from public record. Per-company forensic reports, including the valuation-spread history described here, are available through subscription.